Reading your stats isn't just a vital part of Internet business. It should also be fun. You should enjoy seeing how much money you're making!
We've completely revamped the reports, packing in detailed information that's easy to read and a pleasure to break down both for admins and for advertisers.
The All-New Admin Interface
Log in to the reports page and you'll now see an overview that provides a quick tour of your advertising program. It's clear, it's instantly available and it's easy to understand.
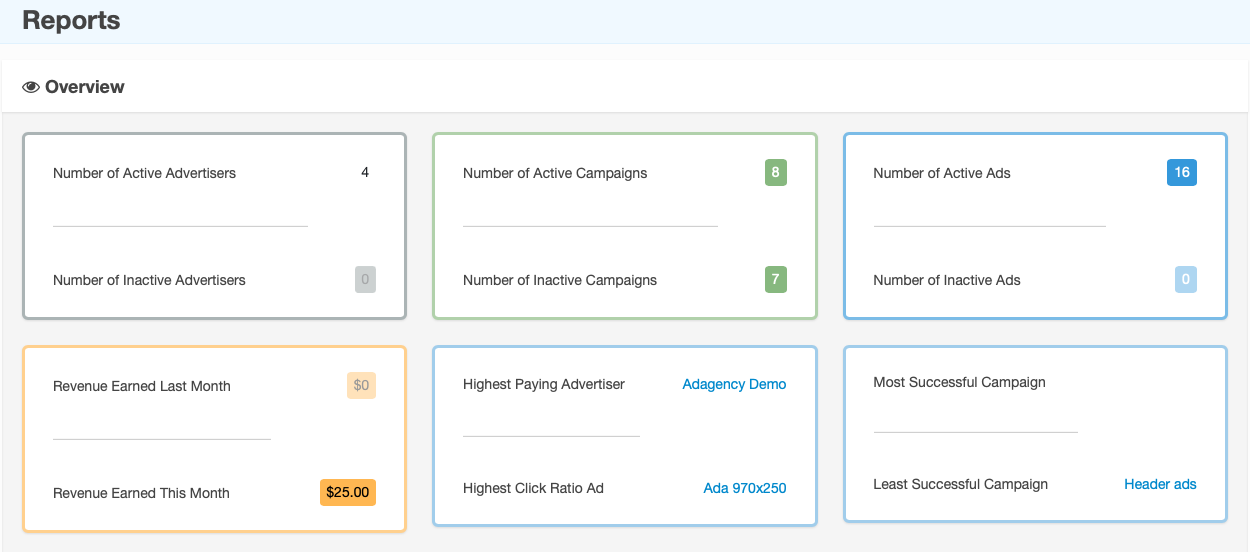
You can use the filter to filter the report you want.
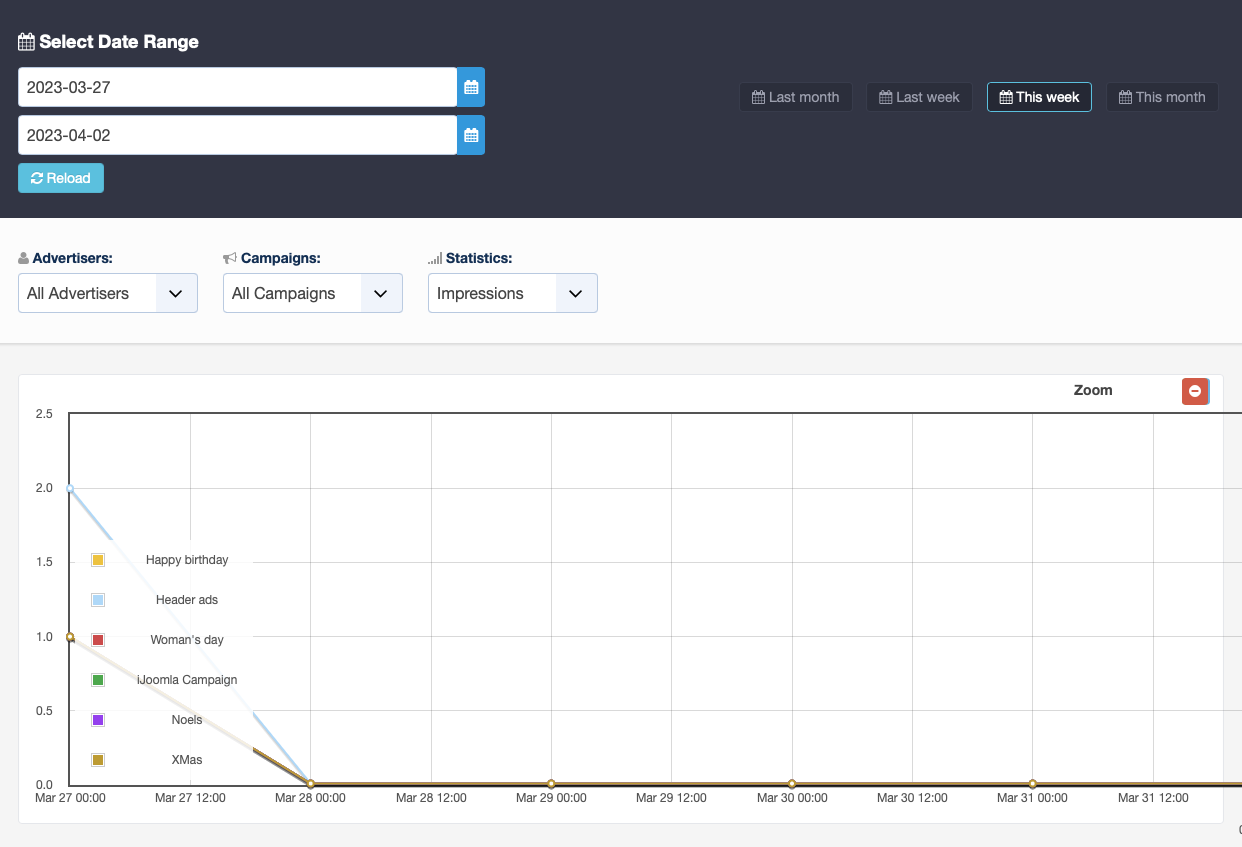
Active/Inactive Advertisers
Now that you can easily which advertisers are inactive, you can reach out to them and make them an offer they can't refuse. Bring them back as paying customers.
Active/Inactive Campaigns
See information on inactive campaigns, talk to the advertisers and help them to relaunch.
Active/Inactive Ads
See which ads have stopped running, and dream up incentives to get them moving again.
Revenue Earned Last Month/This Month
A summary of where you were last month and where you are this one. Expect those figures to keep growing!
Most Paying Advertiser
Spot your best advertiser and make sure they keep promoting on your site and contributing to your revenue.
Highest Click Ratio Ad
See which ad won the highest CTR. Contact that advertiser, show them the stats and use their example to boost the click rates of other advertisers. Keeping your advertisers engaged will keep them coming back and paying for more advertising space.
Most/Least Successful Campaigns
Talk to advertisers whose campaigns are failing and offer them some advice. Show them examples of the most successful campaigns and help them create their ads. They'll see a massive improvement and understand why you're worth paying.
To see the details of any report just click the report's number or name. You'll have all the information you need to keep your advertisers happy — and paying.
A Revamped Advertiser Interface
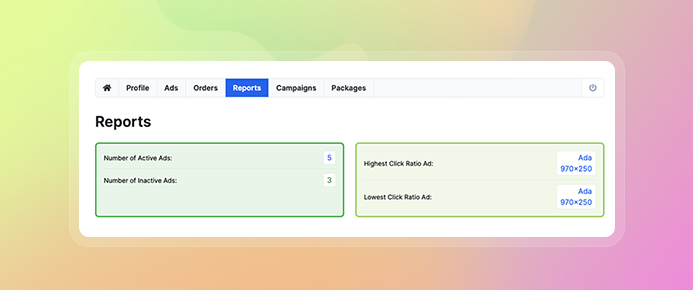
The Advertiser Interface provides detailed information about campaigns and active ads. All information is specific to the advertiser.

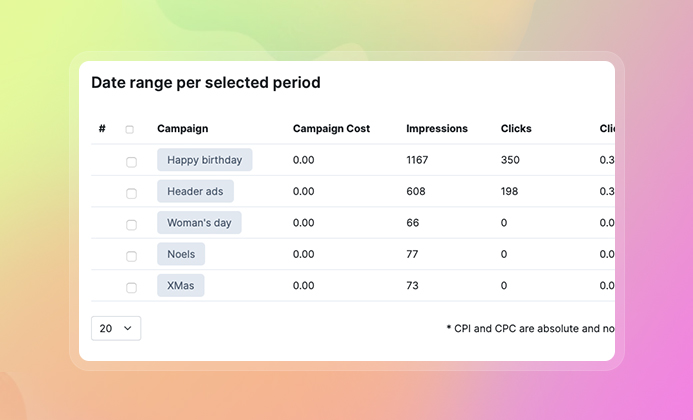
Campaigns
See which ads are doing best; the number of impressions; the number of clicks generated; and even the click ratio. The campaigns view also shows CPI and CPC ad data.
Brand New Graphs
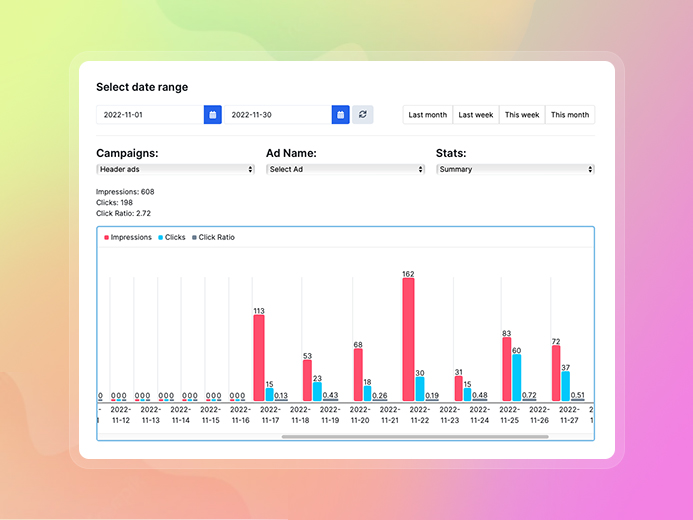
Data is presented in beautiful new graphs. Enjoy a birds-eye view of all an advertiser's campaigns and ads.
Graphs can be adjusted to show a predefined period (Last Month, Last Week, This Week, This Month) or set to show a custom time period.
Graphs also show impressions, clicks and click ratio. All the information you need about your advertisers is just a click away.
Export All Data
In addition to seeing those reports in beautiful graphs, Ad Agency now lets publishers and advertisers export all data as PDF or CSV files. Exported data comes from the tables below the graphs on Overview, Advertisers and Campaign pages.
